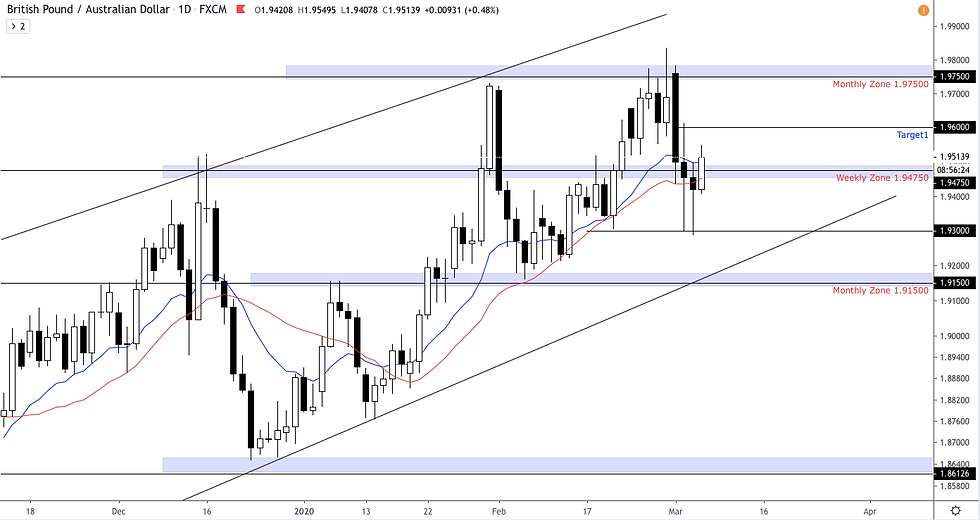
Monthly Time Frame: Starting on the monthly we can see price break and retest 1.91500 monthly psychological. Before the retest we can see a strong bullish engulfing followed by a long wick rejection.

Weekly Time Frame: Scaling down we can see price came down all the way to 1.93000 key psychological support (the midway point of monthly zones) and snapped right back above 1.94750.

Daily Time Frame: Scaling down further we gain a more refined picture of the markets. If price manages to stay above 1.94750 quarterly psychological then, we can anticipate new highs to 1.97500 key psychological. Although if price manages to stay below 1.94750 quarterly psychological then, we can anticipate pull backs to 1.91500 key monthly zone in confluence with the trend line.

4Hr Time Frame: Price managed to break through two trend lines and back above 1.94750. If price maintains above this zone look to buy. Due to uncertainty of market fluidity, risk management is key.
.png)
Comments